Table of contents
Author: Javier M. Floren, Founder of 3DforScience
Are you interested in modular content and omnichannel materials?
Get this free Guide with
5 key steps for The Digital Transformation
of Scientific Communication
Introduction
The life sciences industry is drowning in data. From extensive clinical trials to the ever-growing sea of Real-World Evidence (RWE), we have unprecedented access to information about how diseases progress and how treatments perform. Yet, presenting this data effectively remains a critical challenge. Dense spreadsheets, complex statistical charts, and lengthy reports often fail to convey the true clinical relevance or the human story hidden within the numbers. How can pharma and biotech companies transform this wealth of data from mere points and figures into compelling narratives that resonate with Healthcare Professionals (HCPs), payers, and patients alike? The answer lies in the power of visual storytelling, particularly through sophisticated 3D medical animation.

The Narrative Gap: Why Static Data Falls Short
Traditional methods of data presentation often fall short because they struggle to:
-
Engage the Audience: Static charts and tables can be dry and overwhelming, leading to audience fatigue and difficulty in absorbing key messages.
-
Illustrate Dynamic Processes: Real-world patient journeys, treatment adherence patterns, or the long-term impact of a therapy unfold over time. Static visuals cannot capture this dynamism effectively.
-
Show Complex Interconnections: Representing the intricate relationships between patient characteristics, interventions, biomarkers, and outcomes clearly can be challenging in 2D.
-
Connect Emotionally: Data represents real patient experiences, but standard presentations often fail to bridge the gap between statistical findings and human impact.
Relying solely on these methods means valuable insights within RWE and clinical trial data may not be fully appreciated or understood, hindering effective scientific communication and marketing efforts.

Weaving the Story: How 3D Animation Transforms Data into Narrative
3D medical animation offers a powerful solution to bridge this narrative gap. It moves beyond simple presentation to actively interpret and communicate the story within the data. Here’s how:
-
Visualizing Patient Journeys: Imagine dynamically showing different patient pathways based on RWE – illustrating how treatment choices, adherence, or specific patient factors influence outcomes over months or years. Animation makes these complex journeys intuitive and memorable.
-
Illustrating Complex Relationships: Instead of just stating a correlation, animation can visually depict how different factors interact. It can show how a specific intervention leads to changes in biomarkers and ultimately impacts clinical outcomes, clarifying complex cause-and-effect relationships drawn from data.
-
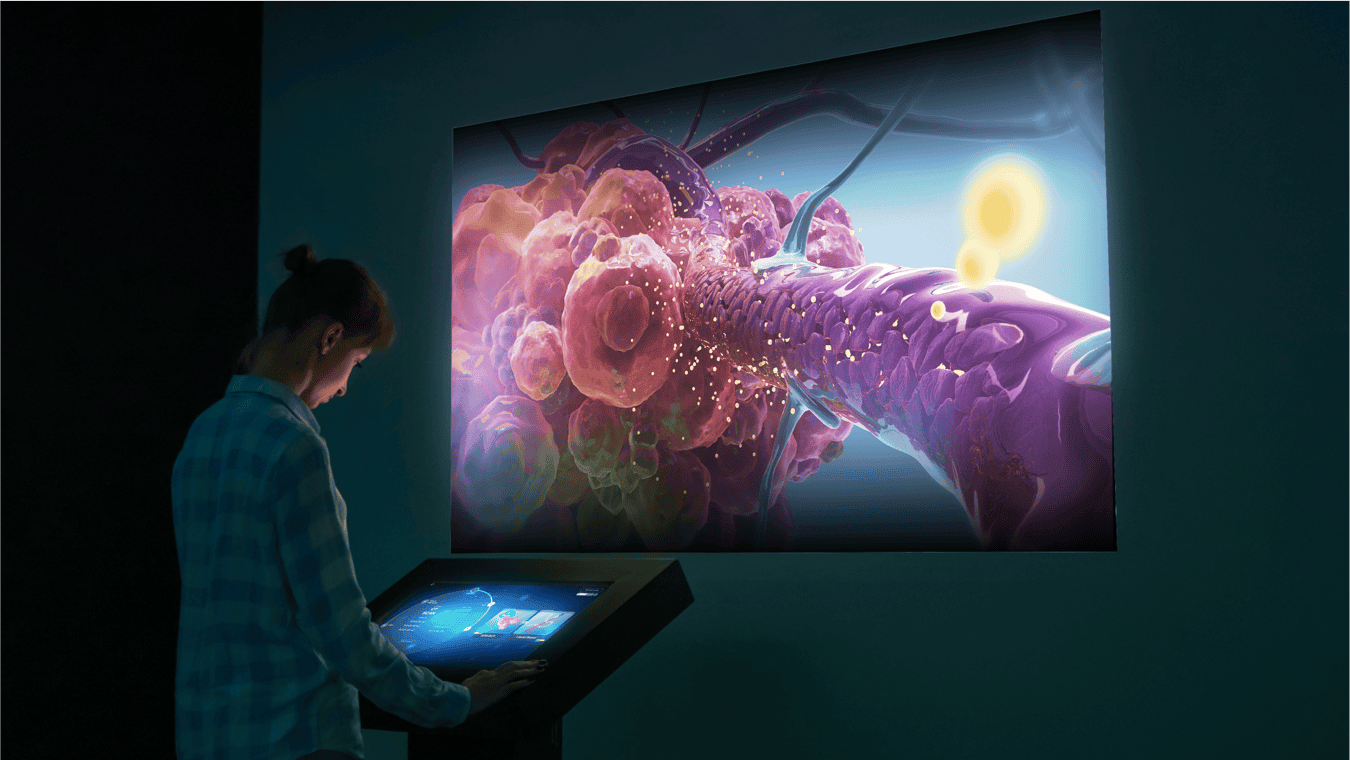
Contextualizing Mechanism of Action (MoA): Seamlessly integrate stunning MoA animations with data visualizations. Show how a drug works at a molecular level and then immediately transition to animated charts or graphics demonstrating its impact on patient populations according to RWE or trial results. This creates a powerful, cohesive narrative.
-
Making Statistics Resonate: Abstract concepts like ‘relative risk reduction’ or ‘number needed to treat’ can be translated into clear, visually intuitive representations. Animation can make statistical findings more tangible and easier to grasp for diverse audiences.
Reaching Hearts and Minds: Engaging Diverse Stakeholders
A data-driven narrative powered by 3D animation speaks effectively to various key audiences:
-
HCPs: Quickly grasp the clinical relevance and practical implications of data for their patients.
-
Payers & HTA Bodies: Clearly see the value proposition, cost-effectiveness, and outcome improvements demonstrated by RWE.
-
Internal Teams (Marketing, Sales, Medical Affairs): Gain a unified, compelling story to communicate product value consistently.
-
Patients & Advocacy Groups: Understand complex information about treatment options and outcomes in a more accessible format (when appropriate).
By transforming data into a story, animation makes information more memorable, persuasive, and impactful.
Bringing Data Narratives to Life: Key Considerations
Creating effective data-driven animations requires careful planning:
-
Scientific Accuracy is Paramount: Ensure all visual representations are faithful to the underlying data and scientific principles.
-
Collaboration is Crucial: Close collaboration between data scientists, medical experts, and animation specialists is essential.
-
Define the Core Message: Start with a clear understanding of the key takeaway or story the data is meant to convey.
-
Choose the Right Style: Select a visual style that is appropriate for the data, the audience, and the overall message.

Conclusion: From Data Overload to Narrative Impact
In an era defined by big data, the ability to communicate findings clearly and engagingly is more critical than ever. Real-World Evidence and clinical trial results hold immense potential, but only if they can be translated into meaningful narratives.
3D medical animation provides the bridge, transforming complex data sets into compelling visual stories that inform, persuade, and resonate. By embracing this technology, pharma and biotech companies can move beyond static data points and unlock the true power of their evidence, driving better understanding and impactful scientific communication. This is where 3DforScience has honed its expertise in recent years, continuously improving the production of medical animations, virtual reality, and augmented reality content.